Wind Farm Site Selection in Virginia
May 11, 2009
Summary
Rapid and unsustainable consumption of fossil fuels in meeting increasing energy demand necessitates the aggressive adoption of renewable and clean energy options. Wind energy is a leading clean energy alternative with demonstrated successes. A key highlight in a May 2008 report by the U.S. Department of Energy (U.S. DoE) titled “20 Percent Wind Energy by 2030,” is the need to increase wind turbine installations by threefold from year 2006 to 2017.
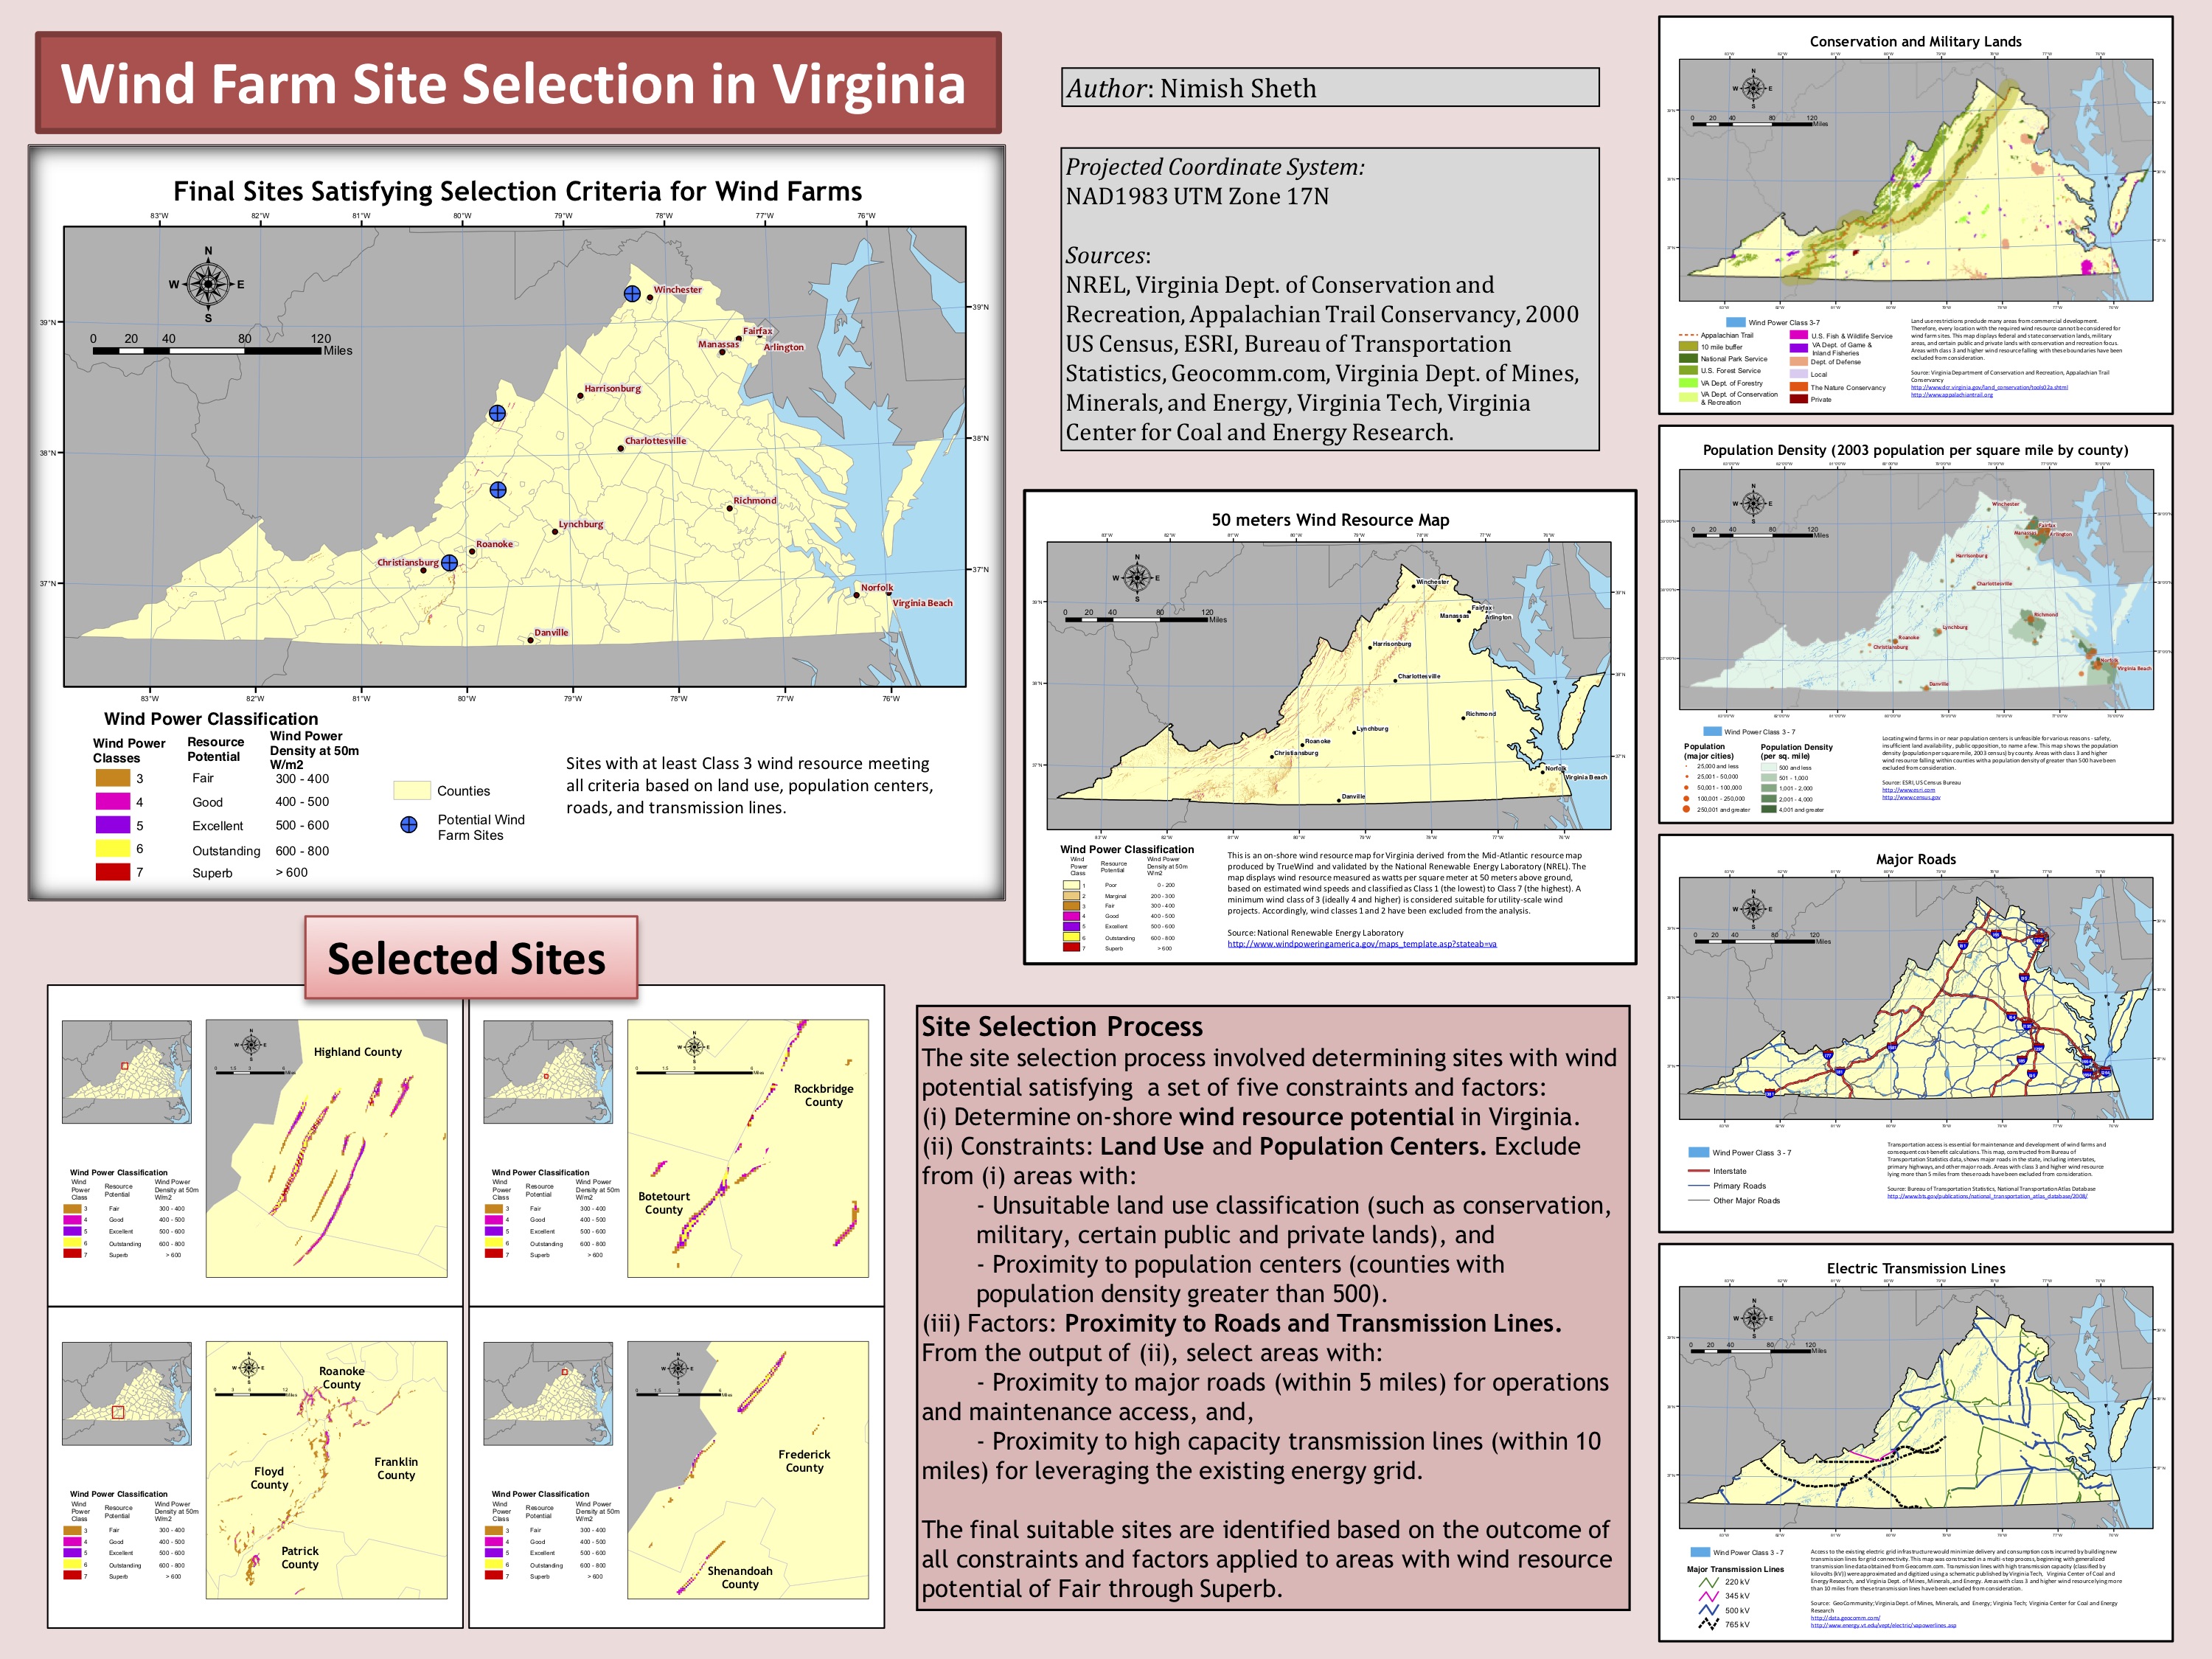
The purpose of this project was to identify suitable on-shore sites for utility-scale wind farms using selection criteria including land use and population constraints as well as influencing factors of transportation access and existing energy infrastructure. Geographic Information Systems (GIS) are used to conduct the necessary manipulation and analysis of geographic data and visualize the outcome. The solution proposed is the selection of four sites for wind farms and screening of additional criteria in future work.
This summary presentation provides the complete analysis. The 2009 Association of American Geographers Annual Meeting featured a poster of this siting analysis.
Goal
The goal of this project is to employ GIS in selecting suitable locations for utility scale on-shore wind farming in Virginia. GIS are a systematic collection and unification of hardware and software, geo-spatial and non-spatial data, application, and people organized for the efficient management, manipulation, analysis, visualization, and presentation of geo-referenced information to gain insights and support decision-making. GIS is a powerful tool in the site screening and selection process.
Objectives
For the current analysis, suitable wind farm locations are defined as sites with:
- wind potential,
- land availability,
- distance from population centers,
- transportation access (roads), and
- proximity to electric transmission lines.
Accordingly, the objectives are:
- Obtain geographical data for on-shore wind resource potential in Virginia.
- Obtain Virginia conservation lands and military area boundaries as defined by federal, state, defense, public, and private organizations.
- Calculate population density (population per square mile) by county for Virginia.
- Locate major roads in Virginia.
- Obtain and construct Virginia’s transmission line data.
Data
During the data collection and analysis phase my research showed that macro wind potential studies often use the Universal Transverse Mercator (UTM) projected coordinate system. With this in mind, I chose to convert all data layers to the North American Datum 1983 (NAD 1983) Geographic Co-ordinate System (GCS) and UTM Zone 17 North Projected Coordinate System. All data used in this project was available for free download from the organizations’ websites.
Base Layer: The 2000 U.S. Census Bureau’s Cartographic Boundary File for the state of Virginia provided a base layer shapefile. For regional context, I also extracted neighboring states’ boundaries from the ESRI “States” shapefle (from GIS Tutorial, 2nd Ed., Exercise Data, 2007”). (Original GCS: NAD 1983; As of: 2000)
Wind Resource Potential: Virginia’s wind resource data is derived from the Mid-Atlantic wind resource shapefile (originally a 200-meter resolution raster dataset), produced by TrueWind and validated by National Renewable Energy Laboratory (NREL). The layer contains wind resource data measured as watts per square meter at 50 meters above ground, based on estimated wind speeds and classified as Class 1 (poor) to Class 7 (superb). (Original GCS: WGS 1984; As of: 2003)
Conservation and Military Lands: I obtained vector data for federal, state, public, and private conservation lands and military areas from the Virginia Department of Conservation and Recreation (VA-DCR) and the Appalachian Trail Conservancy (ATC). David Boyd at VA-DCR graciously helped resolve difficulties in accessing some of the data. (Original GCS: VA-DCR - NAD 1983; As of: 2007; ATC-NAD 1927; As of: 2002)
Population Density: Population density is calculated as population per square mile, by county, using 2003 Census data (from ESRI’s “Counties” shapefile in “GIS tutorial 2nd Ed. Exercise Data, 2007”). (Original GCS: NAD 1983)
Transmission Lines: Base electric transmission lines data came from Geocomm.com and a schematic published by Virginia Tech Dept. of Mines, Minerals, and Energy. (No spatial reference).
Analysis
I began by importing all shapefiles set with the appropriate projection into a personal geo-database. First, I clipped NREL’s Mid-Atlantic wind resource feature class with the Virginia land boundary feature class to obtain Virginia’s on-shore wind resource. High levels of offshore wind potential would be a visual distraction when identifying suitable on-shore locations, and thus, not considered. Since utility scale wind applications require a minimum wind power class of 3 (ideally 4 and higher), I excluded power classes 1 and 2 from the analysis using a “Select by Attribute” operation.
Next, I intersected the wind resource feature class (wind class 3-7) with the conservation and military lands feature class including a 10-mile buffer of the Appalachian Trail, and used the “Switch Selection” option to obtain all wind resource polygons outside the restricted land use boundaries (Output 1). For a macro-siting analysis, I assumed a county level population density was sufficient. To determine population centers, I assumed a population density of greater than 500 people per square mile within a county, and created a new feature class (Output 2). I intersected Output 1 with Output 2, used the “Switch Selection” option, and obtained areas with wind potential in counties with a population density of 500 or less (Output 3).
Using the Bureau of Transportation Statistics’ National Transportation Atlas Database, I clipped the roads feature class (containing roads for six states) with the Virginia boundary to obtain the Virginia roads feature class. From this feature class, I used “Select by Attributes” to create a feature class of interstates, primary and other roads. I set up a buffer of 5 miles around these selected major roads (Output 4). Intersection of the feature classes from Outputs 3 and 4 yielded wind resource locations within 5 miles of major roads (Output 5).
Creating the feature class for transmission lines was the hardest part of this project. I was unable to find readily available transmission line shapefiles from any sources on the internet. Eventually, I downloaded generalized .e00 interchange data for transmission lines in Virginia with sparse to no metadata. Additionally, I found an image schematic of major transmission lines published by Virginia Tech’s Dept. of Mines, Minerals and Energy. I first converted the .e00 file to a coverage, then to a shapefile, set up the correct projections, and created a feature class. Then using the schematic, I digitized approximately high-capacity transmission lines (220kV and greater) as a feature class and created a 10-mile buffer around them (Output 6). The intersection of Outputs 5 and 6 resulted in the final set of polygons representing locations with the necessary wind potential meeting all constraints and factors.
Conclusions
Four sites satisfy the constraints of land use, population centers, access to roads, and proximity to the existing energy infrastructure. I displayed the wind polygons satisfying each criterion (detailed in the series of steps in the Analysis section) with a set of maps. These maps collectively highlight the final sites suitable for wind farm locations. Finally, I created zoomed-in maps of the four sites showing detailed wind class available for easier visualization.
There were a few challenges in conducting this analysis.
- First, it proved to be extremely difficult to obtain precise electric transmission line GIS-ready data. This data is considered proprietary and likely unavailable without a fee.
- Second, I did not have sufficient metadata to clearly select major roads and had to make a judgment based on internet research regarding the filter criteria.
- Third, I did not compute exact distances to roads but relied on a simplified buffering analysis.
Future Research
The current project was limited to on-shore site selection in Virginia. However, the Mid-Atlantic coast has high off-shore wind potential which should be considered for wind energy applications. Additionally, for on-shore wind farm site selection, there are several other considerations that could not be accommodated in the scope of the current analysis. These are terrain (vegetation, soil, slope), orientation (terrain with respect to wind direction), and avian and wildlife impacts (bird and animal habitats, migratory patterns).
References
- “20 Percent Wind Energy by 2030,” U.S. Department of Energy, May 2008.
- Appalachian Trail Conservancy
- Bureau of Transportation Statistics, National Transportation Atlas Database
- Census Bureau
- ESRI
- National Renewable Energy Laboratory
- Virginia Department of Conservation and Recreation
- Virginia Tech, Department of Mines, Minerals, and Energy