Wildfire Threat to the Wildland-Urban Interface in Franklin County, Virginia
May 6, 2010
Summary
Natural wildfires are inherent to regenerative ecological cycles of forests. Assessing and managing wildfire threat in the wildland-urban interface (WUI) is an important natural resource management concern. The WUI is essentially the contact zone between human development and wildland vegetation–where the two intermingle or abut each other. Of particular interest is the threat to life and property, and thus, the heightened need to manage the wildfire risks in the WUI.
Wildfire propensity is predicated on a variety of factors. Topographical features such as terrain slope and orientation as well as surface vegetation combine to form specific fire hazards. A region’s fire history can indicate future ignition hazard. The WUI, based on housing density and vegetation cover, delineates the human-wildland contact zone.
In this project, I have used Geographical Information Systems (GIS) to quantify the fire threat for Franklin County, Virginia and its WUI areas at risk from wildfire ignition and spread. I have created a set of maps to present the geographical assessment and to visualize the fire threatened WUI. These maps can aid natural resource managers in hazard planning and mitigation, and to identify areas requiring further detailed analysis.
This summary presentation provides the complete analysis.
Goals
The purpose of this project was to characterize the wildfire threat to the WUI in Franklin County, a forested and populated county in south-central Virginia. A GIS approach is presented for the necessary manipulation and analysis of spatial data resulting in the visualization of fire threatened WUI areas.
Objectives
Fire risk management literature outlines fundamental factors for assessing wildfire risk, broadly classified as topographic and vegetative fuel hazards, fire risk, housing density, and vegetation cover. Accordingly, the following were the objectives for assessing wildfire risk in the WUI of Franklin County, VA:
- Derive topographic hazards using slope and aspect from a digital elevation model.
- Map vegetative fuel hazard from 13 Anderson Fire Behavior Fuel Models.
- Use historical fire incidents to identify the fire occurrence frequency as a surrogate measure of fire probability.
- Identify the WUI.
- Use GIS techniques to classify and combine the topographic and vegetative hazards, fire frequency, and WUI to identify the fire threatened WUI in Franklin County.
Data
Reference Data: Boundary shapefiles for the state of Virginia and its counties were sourced from the U.S. Census Bureau and United States Geological Survey (USGS). [Original Geographic Coordinate System (GCS): North American Datum (NAD) 1983]
Digital Elevation Model (DEM): DEM data was obtained from USGS, which was used to derive slope, aspect and hillshade layers. [Original Projection: NAD 1983 Albers]
Fire History: A shapefile of fire incidents in Virginia from 1995 to 2001 (inclusive) was obtained from the Virginia Dept. of Forestry (VDoF). [Original Projection: USA Contiguous Lambert Conformal Conic]
13 Anderson Fire Behavior Fuel Models: A raster data set describing 13 surface fuel models (Anderson 1982) was obtained from LANDFIRE, an interagency vegetation, fire, and fuel characteristics mapping project. [Original Projection: NAD 1983 Albers]
Housing Density: U.S. Census data at the block level was used to generate a shapefile with housing density per square kilometer. [Original GCS: NAD 1983]
Wildland-Urban Interface/Intermix: WUI data was sourced in ArcInfo interchange (.e00) format from SILVIS Lab, University of Wisconsin-Madison. This WUI data is derived from 2000 U.S. Census Data and 1992/93 satellite imagery based, 30m resolution, National Land Cover Dataset from USGS. [Original Projection: NAD 1983 Albers]
Projection and Resolution: Franklin County lies in the southern half of Virginia and is fully encompassed by the NAD83 StatePlane Virginia South FIPS 4502 zone. Since my analysis required derivative calculations from DEM data and density calculations based on area, I chose to use a state plane coordinate system projection, which preserves area and distance calculations well. All raster data was converted to 30 meter resolution.
Analysis
I assembled the aforementioned data sets, converted them to the predetermined State Plane coordinate system, and imported them into a file geodatabase.
- Fuels for the study area were modeled based on the 13 Anderson Fire Behavior Fuel Models, broadly categorized into grass, brush, timber, litter, slash. LANDFIRE, a multi- agency fire and fuel mapping project, provides 30m raster data, which was classified into hazard values. Fuels account for 50% of the hazard rating.
- The percent slope was derived from 30m DEM obtained from USGS. The slope hazard values are based on the National Fire Protection Association (NFPA) 1144 (2002 edition) and accounts for 30% of the overall hazard rating.
- Slope direction (aspect) is also derived from 30m DEM obtained from USGS. Hazard values are assigned to the 8 principal directions. South and west facing slopes are drier and often more vegetated due to higher solar radiation. Aspect accounts for 20% of the overall hazard rating.
Table 1. Assessment factors, hazard values and hazard categories.
| Factor | Classification | Hazard Value | Hazard Category | Percent Influence |
|---|---|---|---|---|
| Fuels | 2 - Timber (grass, understory) | 10 | Very High | 50% |
| 5 – Brush (2 feet) | 10 | Very High | ||
| 8 – Closed timber litter | 8 | High | ||
| 9 – Hardwood litter (long needle pine) | 8 | High | ||
| 11 – Light slash | 6 | Moderate | ||
| 93 – Agriculture | 2 | Low | ||
| Slope | < 10% | 1 | Very Low | 30% |
| 10 – 20% | 4 | Low | ||
| 20 – 30% | 7 | Moderate | ||
| 30 – 40% | 8 | High | ||
| > 40% | 10 | Very High | ||
| Aspect | Flat (-1); N(0-31.5, 337.5-360 deg) | 1 | Very Low | 20% |
| NE (31.5-67.5 deg) | 3 | Low | ||
| E (67.5-112.5 deg) | 4 | Moderate | ||
| SE (112.5-157.5 deg), SW (202.5-247.5 deg) |
9 | Very High | ||
| S (157.5-202.5 deg) | 10 | Very High | ||
| W (247.5-292.5 deg | 7 | High | ||
| NW (292.5-337.5 deg) | 5 | Moderate |
Each dataset was reclassified to a 10-point hazard value and weighted as denoted in Table 1, to achieve a combined final hazard score. This final score was reclassified to a combined hazard category (Very Low to Very High) using equal interval classification.
- Fire frequency (risk) was determined using historical fire incidents for the study area with the assumption that these spatial fire patterns would continue in the future (VDoF). Fire incidents from 1995-2001 were used as input (the notion being that burned areas could have regenerated over time) to create a Kernel Density output with a 5km search radius (VDoF). The output was reclassified as: 0 – 0.09: Rare; 0.09-0.19 (Frequent); > 0.19 (Very Frequent). The combined hazard category (fuels, slope, aspect) and fire risk rasters were classified into a threat matrix (15 unique combinations), and reclassified to a final fire threat categorization (Very Low – Very High).
- Wildland-Urban Intermix/Interface is the area where housing intermingles or is in the vicinity of vegetation. WUI has more than 1 house per 40 acres (approx. 6.18 units/sq. km.): intermix areas have more than 50% vegetation cover; interface areas have less than 50% vegetation cover but lie within 1.5 miles of an area over 1,325 acres with 75% vegetation cover (Federal Register, 2001; SILVIS Lab, U. Wisconsin). This buffer distance addresses the notion that areas in the vicinity of wildlands are also at risk. It also ensures exclusion of areas surrounding urban parks (SILVIS Lab).
The WUI was intersected with the final fire threat categories to obtain the fire threatened WUI in the Franklin County.
Results
- Franklin County is 7th largest by area (692 sq. miles of land) and 24th by population (47,286) in Virginia.
- The western edge of the county in the Blue Ridge foothills has steep slopes, while the rest has low slope.
- Over 41% of terrain is generally south-facing.
- Over 68% of the county is categorized having moderate or higher fuel hazard.
- The central part of the county, in the north-south direction, has experienced frequent fire activity between 1995 and 2001.
- Also, the central part of the county has a housing density of greater than 6 units per sq. km., with higher densities in the north-central region.
- Finally, the WUI in the county also runs down the center in the north-south direction.
Conclusions
The accompanying presentation and digital project files provide a model of the geoprocessing steps and maps of the results.
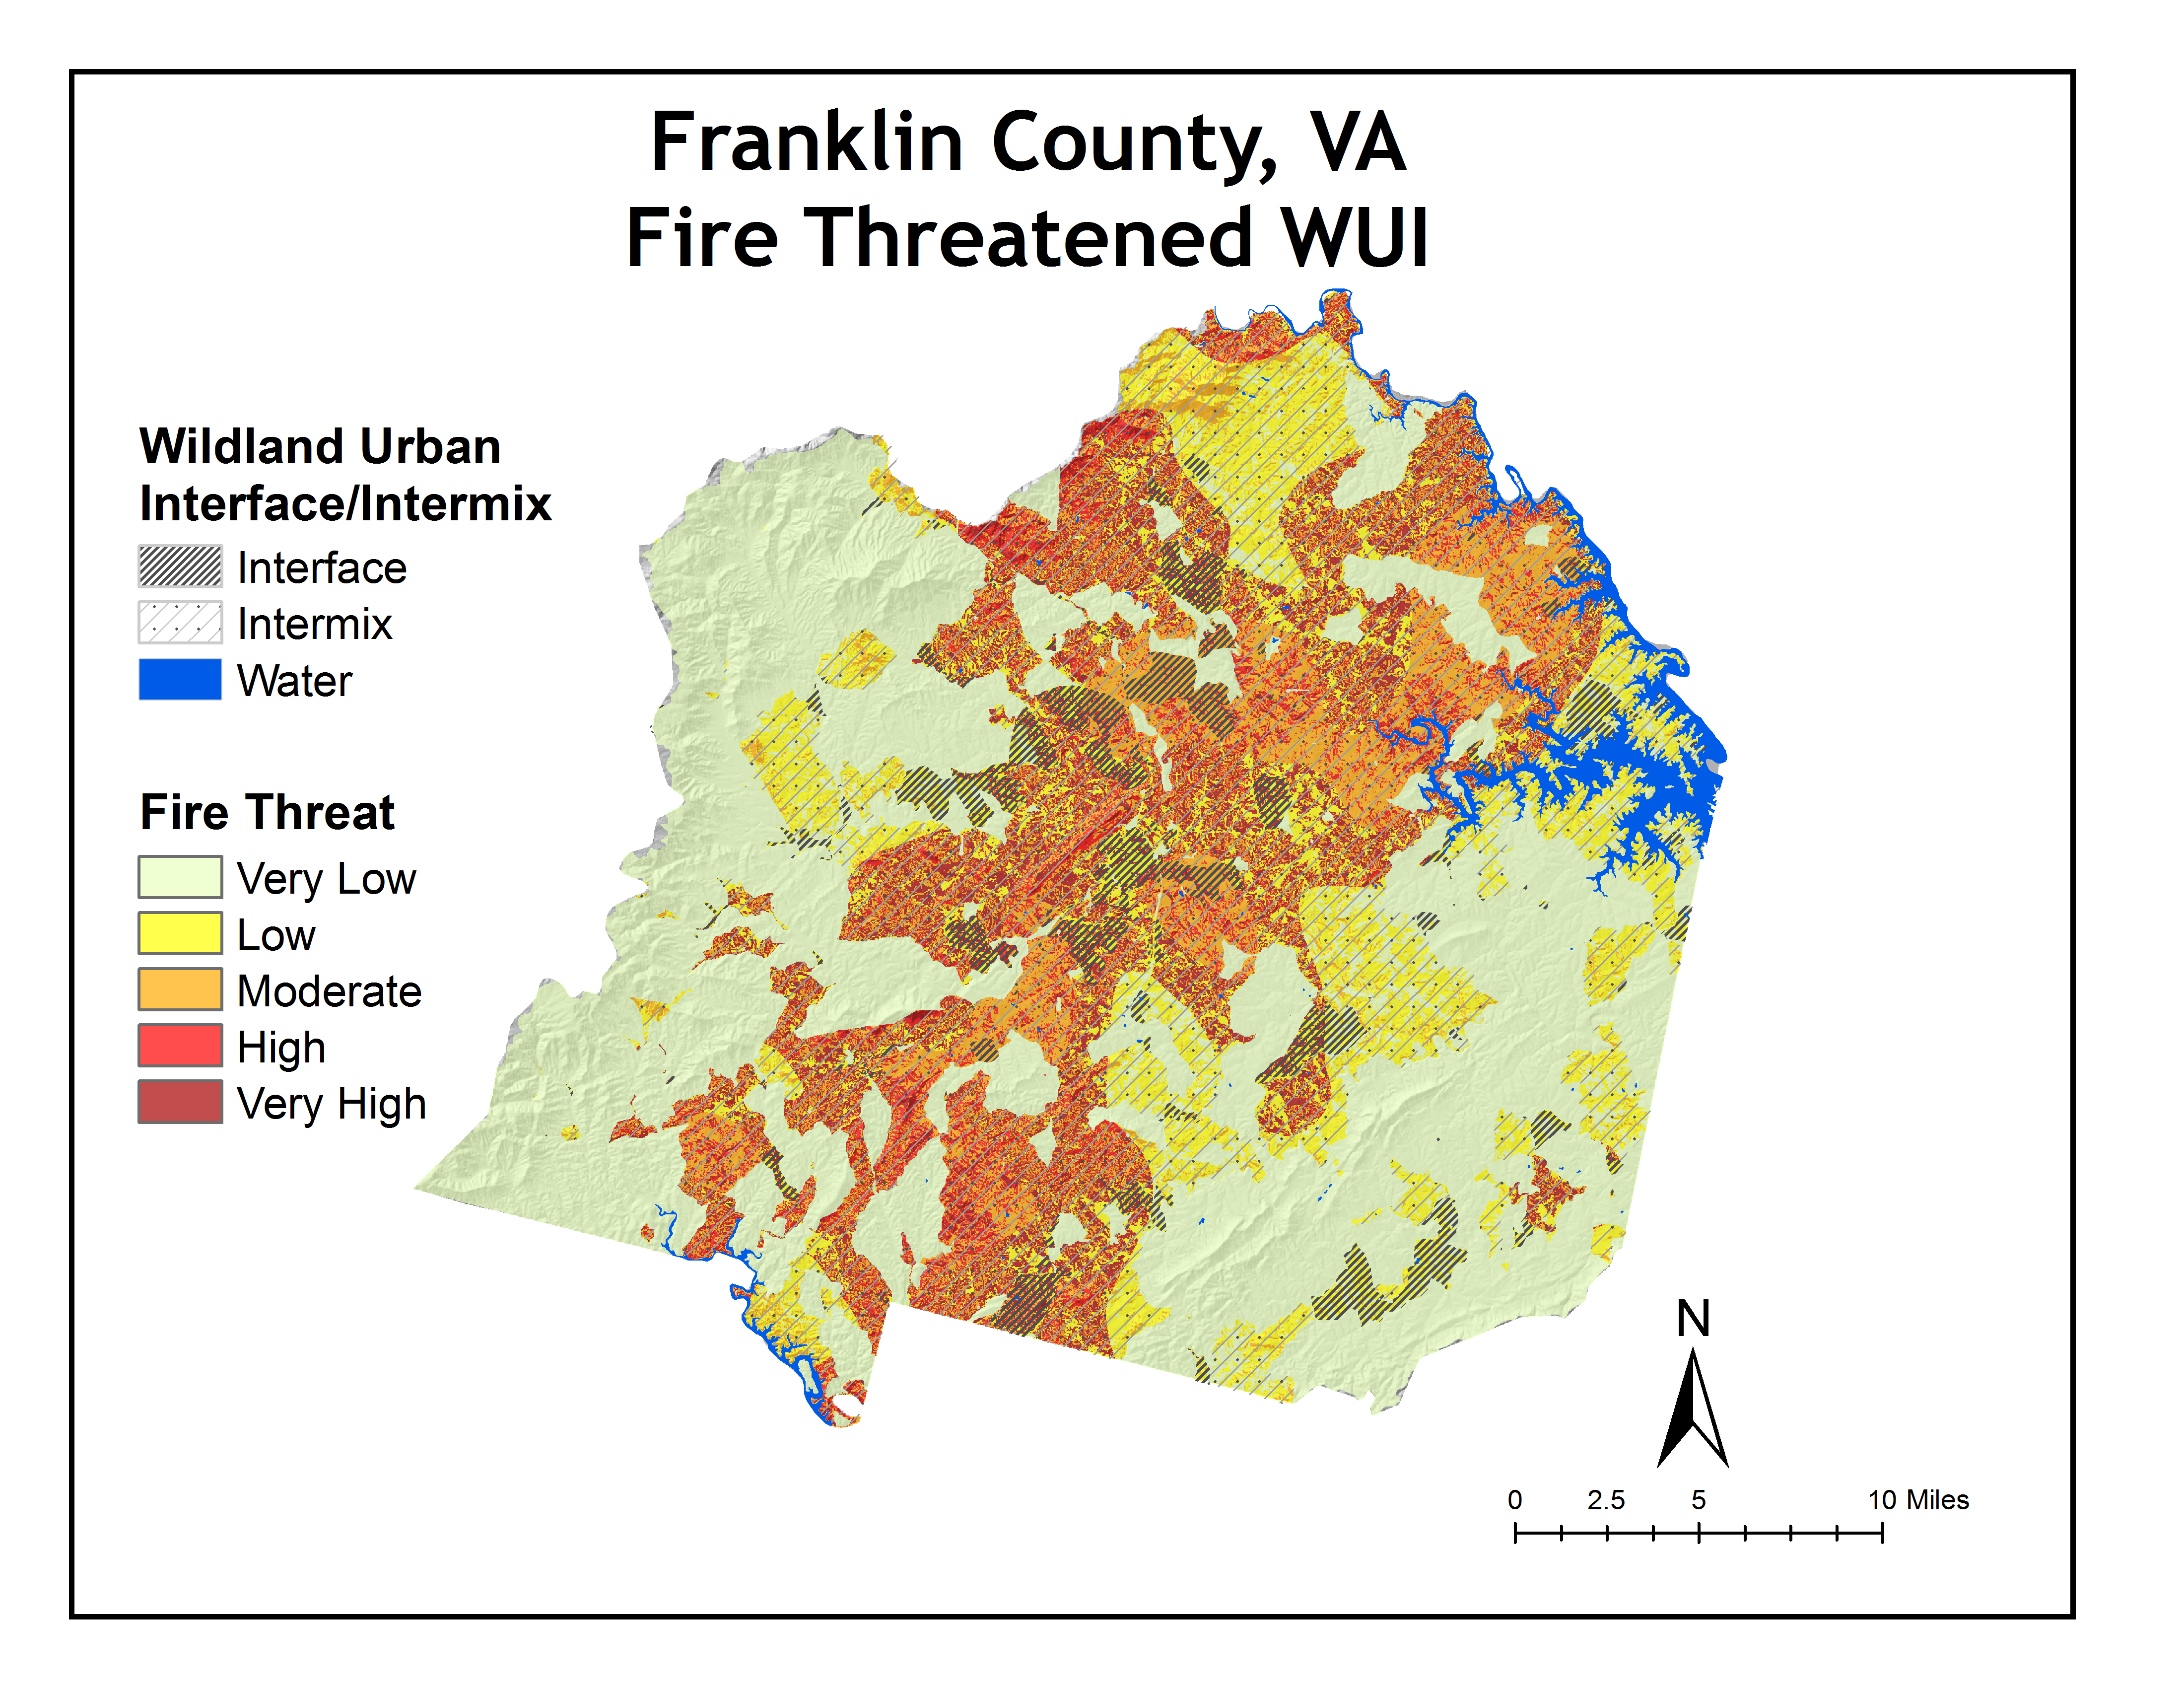
The final fire threatened WUI map spatially illustrates the relative fire risk across the county at a broad level. The analysis results can help fire managers better allocate scarce resources in mitigation, response, prescribed burn, and suppression strategies to prevent and minimize non-natural ecological destruction as well as loss of life and property.
Future Research
This project has several areas for further analysis and improvement. Inclusion of climatic patterns can assist in temporal awareness of fire behavior and better use of resources. Using alternate fuel models based on the geographic region could yield higher accuracy. Lightning strikes are another important factor to consider for fire ignition probability. Proximity to roads and railway tracks could be used as a proxy for human caused wildfire ignition. The response time to a wildfire, water sources, and precipitation data could help with prediction of human and natural fire suppression scenarios.
References
- Anderson, Hal E. (1982) “Aids to determining fuel models for estimating fire behavior.”
- Federal Register (66:751, 2001) [report on WUI communities at risk].
- LANDFIRE. Accessed April 2010.
- National Fire Protection Association (NFPA) 1144 (2002 edition)
- SILVIS Lab, Forest and Wildlife Ecology, University of Wisconsin-Madison. Accessed March 2010.
- United States Geological Survey (USGS). Accessed March 2010.
- U.S. Census Bureau. Accessed April 2010.
- Virginia Department of Forestry (VDoF). Accessed April 2010.