Rating Customers for Financial Crime Risk
March 17, 2021
I have worked extensively in the FinReg and RegTech space, specifically the development and validation of software and technology for anti-money laundering (AML), combating financing of terrorism (CFT), and identifying fraud and trading risk and irregularities. Pre 9/11, I built the first generation of financial crime behavior detection models at a pioneering start up, and subsequent iterations addressing the sweeping regulatory requirements of the USA PATRIOT Act of 2001.
The technical aspects of my work include data preparation (exploratory analysis, visualization, building ETL pipelines, cleansing, aggregating and summarizing data, and statistical analysis), model development, and validation. I have also built solutions for householding, segmentation, collating transactions, entity resolution, text extraction, address parsing, and name matching. I have used a variety of tools, but have a bias for SQL, R, Python, and Informatica.
Due to the sensitive and proprietary nature of this work and client confidentiality agreements I cannot provide technical details or code I’ve used. Instead I discuss the regulatory drivers and conceptual aspects of development and validation.
Background
According to the United Nations office on Drugs and Crime (UNODC), approximately 2 - 5% of global GDP, or $800 billion to $2 trillion in current US dollars (or approx. the GDP of Japan), is laundered globally per year. Money laundering requires the participation of entities, which eventually involves people. These are the people who conduct financial transactions to “launder money” — move money in a series of steps to wash or hide its true origins — using the financial system constituting large and small institutions such as banks, broker/dealers, mutual funds, non-banking financial institutions (NBFIs), FinTech companies, and others. To conduct financial transactions, these people have to be customers of financial institutions, somewhere in the chain, to own and operate the accounts through which money is laundered.
To combat money laundering, regulators and financial institutions are now focused, more than ever, on performing extensive due diligence of their customers, from account opening through the customer relationship lifecycle, to continually identify and evaluate the actual and beneficial owners behind accounts and the financial crime risk they pose based on their characteristics.
Regulatory context
In the United States, anti-money laundering (AML) efforts can be traced from the Bank Secrecy Act (BSA) of 1970 leading up to the expansive USA PATRIOT Act of 2001 passed after 9/11 to the sweeping changes of the Anti-Money Laundering Act of 2020. These and other AML regulations require every financial institution (FI) to have an AML posture providing a reasonable ability to define, detect, decide, and disclose suspicious activity and targeted entities of interest and typically comprises:
- Know Your Customer (KYC)
- Customer Identification Program (CIP)
- Customer Due Diligence (CDD)
- Enhanced Due Diligence (EDD)
- Customer Risk Rating (CRR)
- Beneficial Ownership (BO)
- Transaction Surveillance
- Transaction Monitoring (TM) (scenario alert generation)
- Sanctions Screening (transaction filtering)
- Review and Resolution
- Alert and Case Management
- Audit History and Records Management
What is financial crime risk?
To understand financial crime risk let’s first look at the meaning of risk.
Risk is a state of unpredictability due to imperfect or unknown information where a subset of possible outcomes has a high potential for deleterious effects.
Risk taking is to accept this unpredictability. That is, accepting that we cannot know:
- if the undesirable outcomes will occur
- if they occur, when they will occur
- if we can manage them when they do occur
In the context of financial crimes, an FI’s customer risk is the possibility that the customer engages in money laundering or other illegal activity using the FI’s payment systems and it goes undetected, exposing the FI to regulatory, financial, and reputational damage.
By definition, an FI has to have customers. Theoretically, any customer poses potential financial crime risk. So, the FI’s task is to manage the lack of knowledge or unpredictability about which customers may actually conduct financial crime using the FI’s payment systems.
Risk perception is the subjective sentiment –– cognitive, contextual, personal, and, emotional –– of a risk’s occurrence and its severity.
The FI has to make a conscious choice — based on probabilistic assumptions — of engaging in, maintaining, and adapting relationships with customers by accepting a certain threshold of unpredictability and mitigating that unpredictability.
But customer risk is not easily quantifiable. Customer risk is judged based on experience and known correlation with specific characteristics (factors): type of customer (person v. entity), geographical considerations (not all countries exhibit the same risk vulnerabilities or have same level of AML enforcement), types of activity (electronic v. cash, large v. small amounts, domestic v. international, regular v. irregular).
The FI must have the ability to categorize or predict customers’ potential financial crime risk based on data evidence so that the risk can be managed within some established risk tolerance.
Why is CRR needed?
Every covered FI in the United States has a legal obligation to comply with US AML regulatory requirements. Know Your Customer (KYC) is a key component of AML processes that an FI must establish to verify the identity of its customers as well as establish the risk of its customers based on various characteristics of ownership (actual people) and transactional activity. KYC itself may comprise separate components.
Regulatory requirement
A critical part of an FI’s AML obligation under KYC is complying with the Customer Due Diligence Requirements issued by the US Department of Treasury’s Financial Crime Enforcement Network (FinCEN) on May 11, 2016 and guidance issued in FIN-2016-G003 on July 19, 2016 and in FIN-2018-G001 on April 3, 2018:
FinCEN issued the CDD Rule, which amends Bank Secrecy Act regulations, to improve financial transparency and prevent criminals and terrorists from misusing companies to disguise their illicit activities and launder their ill-gotten gains. The CDD rule clarifies and strengthens customer due diligence requirements for U.S. banks, mutual funds brokers or dealers in securities, futures commission merchants, and introducing brokers in commodities and adds a new requirement for these covered financial institutions to identify and verify the identity the natural persons (known as beneficial owners) of legal entity customers who own, control, and profit from companies when those companies open accounts. – FinCEN CDD Rule news release
According to FinCEN Final CDD Rule, May 11, 2018:
The CDD Rule requires covered financial institutions to establish and maintain written policies and procedures that are reasonably designed to:
- identify and verify the identity of customers
- identify and verify beneficial owners of companies opening accounts
- understand the nature and purpose of customer relationships to develop customer risk profiles
- conduct ongoing monitoring to identify and report suspicious transactions and, on a risk basis, to maintain and update customer information
And in a joint statement issued in December 2018, FinCEN and its regulatory partners (the Board of Governors of the Federal Reserve System, the Federal Deposit Insurance Corporation, the National Credit Union Administration, and the Office of the Comptroller of the Currency) encouraged FI’s to innovate and explore adoption of new technologies for combating money laundering and making compliance programs more effective. This public regulatory acknowledgement promotes FIs to experiment with novel approaches for AML, including CRR.
How do you know if you know your customer?
So, it is clear from regulatory requirements that an FI is required to have KYC processes providing reasonable and necessary steps to establish and verify the identity of its customers.
“a written program appropriate for the bank’s size and type of business” and must include “risk based procedures to form a reasonable belief that it knows the true identity of each customer.” – Section 326, 31 CFR § 1020.220 of the USA PATRIOT ACT
But how does an FI get to know its customer?
There are three aspects of knowing your customer:
- Customer Identification Program (CIP) Verify identity of individual or entity opening accounts for conducting financial transactions (one time event)
- New customers (people, legal entities, beneficial owners)
- Information (name, date of birth, addresses, identification number)
- Identity verification (documents, government records, consumer reporting agency,…)
- Beneficial Ownership (identify and verify ultimate person(s) controlling the account in the case of legal entities)
- Sanctions screening (OFAC and other watch list checks)
- Customer Due Diligence (CDD) Analyze customer relationship from money laundering perspective (on an ongoing basis)
- Assess risk factors (CIP, demographic, geography, products, accounts, services, expected activity, actual activity, transaction monitoring alerts)
- Customer Risk Rating based on risk factors
- Ongoing and periodic
- Out of cycle based on event triggers
- Can be promoted to EDD based on high risk factors
- Enhanced Due Diligence (EDD) (as triggered by events or characteristics)
- Extra scrutiny of high risk customers such as customers with high net worth, conducting large transactions, engaging with high risk jurisdictions.
KYC = CIP (one time) + CDD (ongoing) + EDD (ongoing)
As part of satisfying the FinCEN CDD Rule, customer risk rating is a way for an FI to manage customer risk by categorizing customers based on the estimated or predicted risk for money laundering, or financial crimes in general. With this type of risk based approach, the FI can expend resources judiciously on monitoring closely customers with higher risk instead of monitoring all customers with the same level of scrutiny.
How to build a model
Ok, we’ve established that every customer poses some kind of risk to the FI and FIs need to risk rate customers. So how do we do that?
While transaction monitoring evaluates the risk or suspicion of wrong doing in transactional activity, often an FI is unable to articulate and justify clearly the risk its customer poses with respect to their customer profile, geographic indicators, and transactional activity.
Every FI has its own unique considerations: customer base characteristics and size, geographic extent of their customers and business, types of transactional activity, domestic or global presence, subjective judgement of risk, and risk tolerance, all of which need careful analysis and consideration.
Adopting a risk based approach to customer risk rating requires you to work through the following:
- Customer segmentation How do you want to divide your customer base into more homogenous sub-groups?
- Risk factors Which risk factors does your institution want to use? Which are required by regulation?
- Applicability Which risk factors are applicable to your business? (will be different for global bank v. community bank / private wealth banking v. correspondent banking / …)
- Auto high risk What criteria do your want to use (if any) for auto high risk assignment? Should the risk model generate a rating even for auto-high risk cases for comparison / evaluating model performance?
- Quantifying risk factors How to translate raw risk factor values into risk levels?
- Transaction Monitoring alerts How do you incorporate transaction monitoring alerts into risk rating?
- Weighting What is the weighting scheme (relative importance) for risk factors?
- Customer Risk Rating categories What are the levels or groups for CRR?
With these methodology considerations in place, you then have to establish the following:
- Data availability and quality What is the state of data?
- Model type What type of model do you want to use? (weighted average, decision tree, regression, hybrid,…)
- Ongoing monitoring and outcomes analysis How and at what intervals will you assess model function and performance?
Let’s look at each of these.
Customer segmentation
At the simplest level customers are of two types: individuals and non-individuals (e.g., persons v. business / commercial / other entities). But this doesn’t tell you much about the different types of customers within each type –– e.g., individuals who are retail v. private banking clients; non-individuals who are corporations v. government entities v. banks v. hedge funds. Depending on the FI’s business model and structure, it is a good idea to divide the customer base into finite segments representing the diversity of the customer type characteristics. This helps in creating groups where members of each group are homogenous or similar.
The main driver for client segmentation is to be able to select risk factors that have uniform and meaningful applicability within the segment. This is important as not all risk factors will be applicable to all segments. Too many segments can easily become counter productive as the model subdivision would become unwieldy and maintenance needs would be high. If not segmented well, you would not achieve meaningful stratification.
- Decide on customer segments (e.g., Individuals, Corporations, Banks, Government Entities,…)
- Decide on sub-segments as applicable or needed (e.g., Individuals could be sub-divided into high net worth clients and retail; Corporations could be small businesses, public, privately held; Banks could be correspondent banks, wholesale banks, non-banking financial institutions, and so on)
- Keep segmentation consistent with other processes that will interact or provide input to the CRR model (e.g., front end KYC processes, data warehouses, reference data sources)
Risk factors
A risk based approach for financial crime customer risk rating requires identifying the types of risk factors to be used as input criteria. You have to determine which attributes should impact the possibility of a customer engaging in financial crime, specifically money laundering.
It is quite universally recognized that there isn’t a well defined set of benchmarks against which to measure customer risk characteristics (factors) or how to assign relative importance (weights / scores) to said characteristics.
There is no factual, evidence based consensus about which risk factors must be used in CRR, measuring the risk posed by a given risk factor, or quantifying the risk levels of a risk factor.
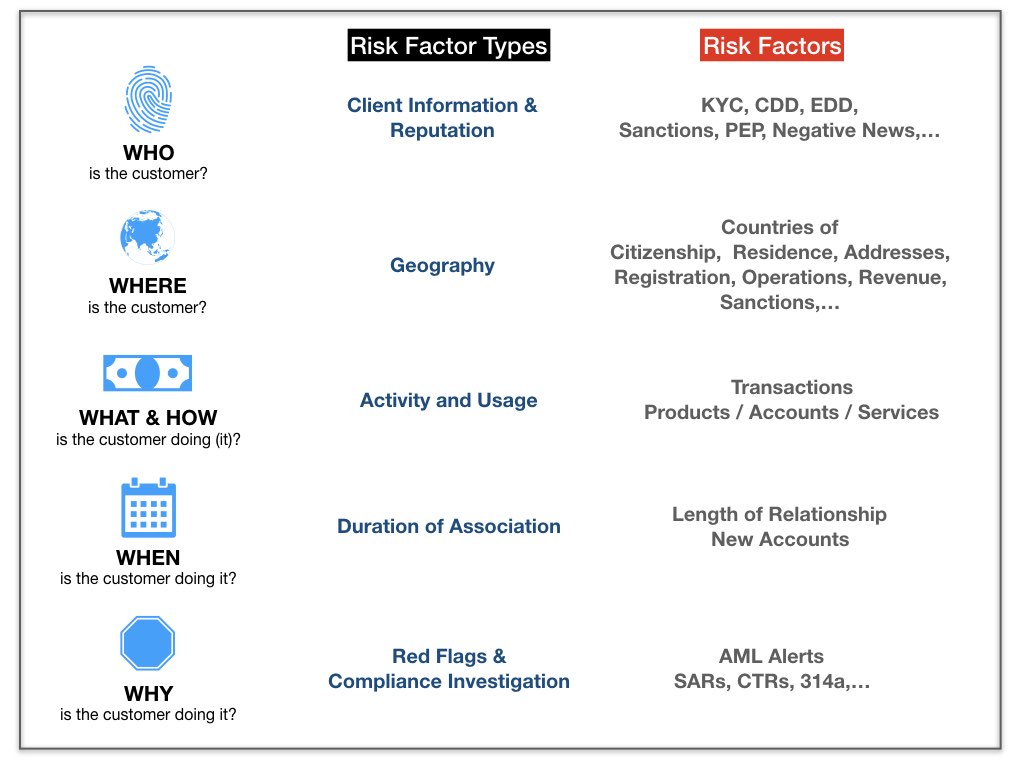
The main guidance for risk factor selection is the FFIEC BSA / AML Examination Manual. The guidance essentially suggests choosing risk factors that can help describe the customer as comprehensively as possible. You can simplify this by asking the fundamental questions shown in the following graphic.
What constitutes risk in a risk factor?
In the absence of empirical evidence, judgements formed from experience have typically suggested causal linkages between risk factors and money laundering. And so, expert opinion of compliance professionals and regulatory requirements tend to shape the selection of risk factors.
But humans usually evaluate risk by simple, pairwise comparisons –– comparing two criteria while holding all other things constant. Consider the questions:
- What is the relative risk posed by a customer’s Country of Citizenship (citizen of Cuba) v. Occupation (owner of convenience store)?
- What is the relative risk of two customers with identical characteristics, where one is a citizen of Cuba and the other is a citizen of the United Kingdom? (The former will be assigned higher risk because of a higher country level risk attributed to Cuba based on regulatory and political policy).
- What is relatively riskier –– Country of Registration or Country of Operations?
Risk perception is the driver for such assessments.
Intuitively, we can describe individual or retail customers with demographic and profile characteristics. But we need relatively more attributes to describe non-individual or legal entity clients –– we may be able use some demographic attributes related to people who are linked to the legal entity but we also need a variety of other attributes to describe the entity itself. These attributes can help draw an association with customer risk.
Non-individual / legal entity / commercial clients pose a significantly higher AML risk as these are the conduits necessary for financial crime. Money launderers rely on the legitimacy of the participants, especially the business entities, required to move the illicit money through chains of transactions to make them appear legitimate.
Let’s look at the motivation for commonly adopted risk factors.
Individuals
| Risk factor | Spectrum (low –– high) | Reason for risk |
|---|---|---|
| Customer | Client information | |
| Account Ownership | Related owners –– Unrelated owners | Unrelated parties have signing roles or same owner has controlling authority on accounts with different, unrelated owners may indicate collusion, especially with suspicious transaction activity such as rapid movement of funds. |
| Occupation | Salaried employee –– Self employed / Independent Business Owner / Professional Services | Unemployed, Housewife, Student, Retired are often used to provide opaque employment status and denote higher risk; Self-employed, professional services (e.g, Dentist, Accountant) denote risk as illicit money can be mixed easily with actual business revenue. |
| Geographic | Country risk propagated through geographic factors | |
| Citizenship | US Citizen –– Citizen of Low Risk Country –– Resident Alien / Citizen of High Risk Country | Ties to high risk country or non-resident alien status (possible mule or smurfer) denotes higher risk. |
| Residency | Low Risk Country –– High Risk Country | High risk country or account opened in jurisdiction different from residency denotes higher risk. |
| Duration of Association | Length of time customer has been known | |
| Account Opening Method | In Person –– Digital | Digital channels offer anonymity and opportunity for using third-party identities; however, this is a meaningful risk early in the relationship (digital account opening for an established, proven low risk customer is just noise). |
| Length of Relationship | Established (greater than 3-5 years) –– New (less than 1 year) | Accounts are typically opened for immediate money laundering use. So, newer customers and accounts pose higher risk (no historical activity for comparison). Longer customer relationship implies established pattern of behavior to determine relative risk. |
| Number of new accounts | Few –– Many | Several new accounts indicate risk. |
| Transaction Activity | Usage of products and services | |
| Products & Services | Not risky –– Risky | Use of risky products or products that may enable money movement (e.g., mortgages, personal loans, insurance vehicles). FI has to map risk to products. |
| Transactions | Not risky –– Risky | Use of transactions not typical of customer profile or peers. FI has to map risk to transactions. |
| Red flags | Regulatory / Compliance | |
| Politically Exposed Person (PEP), Public figure | No –– Yes | Prominence and access implies risk of bribery, corruption, financial crime, especially if affiliation is with high risk country. |
| Sanctions | No –– Yes | Regulatory risk |
| Alerts, SARs | No –– Yes | Indicator of potentially suspicious activity. |
| Self reported | Not particularly useful unless verifiable | |
| Net Worth, Source of Wealth | Salary –– Other | Self-reported and typically unreliable. |
| Anticipated Activity | No deviation –– Increasing deviation | Self-reported and typically unreliable. Can legitimately change with time. Better gauge is actual activity relative to balance maintained: high churn of funds may be risk indicator. |
Commercial/Legal Entity
| Risk factor | Spectrum (low –– high) | Reason for risk |
|---|---|---|
| Customer | Client information | |
| Account Ownership | Transparent –– Complex layers | Complexity implies difficulty in verification and masking of true ownership. |
| Legal Entity Structure | Sole Proprietor, Publicly listed company –– LLCs, joint ventures, limited partnerships, trusts, unincorporated business, non-profit, exotic funds, nested correspondent banks | Complexity indicates distancing of beneficial ownership and potential shell structure (e.g., Nominee Incorporation Services (NIS), Private Investment Companies (PIC)). |
| Industry | Industry dependent risk | Regulatory and legal indicators denote higher risk for certain industries. |
| Cash intensive business | No –– Yes | Cash heavy businesses (like convenience store, restaurant, marijuana related business, vape shop, crypto currency, casinos, car wash, private ATM operator, money service business, nail salon, liquor store) provide opportunity for intermingling illicit funds with normal business revenue. Nature of such businesses involves transitory customers and high degree of anonymity. |
| Regulatory Oversight | Third party / Regulatory oversight –– No oversight | Lack of oversight indicates non-audited financial activity. |
| Geographic | Country risk propagated through geographic factors | |
| Registration, Formation, Domicile, Operations, Revenue countries | Low risk country –– High risk country | Sanctioned & watchlist countries pose higher risk. |
| Duration of Association | Length of time customer has been known | |
| Length of Relationship | Established (greater than 3-5 years) –– New (less than 1 year) | Accounts are typically opened for immediate money laundering use. So, newer customers and accounts pose higher risk (no historical activity for comparison). Longer customer relationship implies established pattern of behavior to determine relative risk. |
| Age of entity / business / enterprise | Established –– New | Recently formed entity is riskier than an established one that has known business activity or public information. |
| Transaction Activity | Usage of products and services | |
| Products & Services | Not risky –– Risky | Use of risky products or products that may enable money movement (e.g., complex derivatives, structured finance, leases, business loans, insurance vehicles, precious metals). FI has to map risk to products. |
| Transactions | Not risky –– Risky | Use of transactions not typical of customer profile or peers. FI has to map risk to transactions. |
| Foreign / Cross Border Activity | No –– Yes | Foreign transactions, especially with high risk jurisdictions, such as import/export, open account trading (direct payments from buyer to shipper after buyer receives goods without third-party documentation or protection), trade based money laundering through over or under invoicing. |
| Red flags | Regulatory / Compliance | |
| Politically Exposed Person (PEP), Public figure | No –– Yes | Prominence and access implies risk of bribery, corruption, financial crime, especially if affiliation is with high risk country. |
| Sanctions | No –– Yes | Regulatory risk |
| Alerts, SARs | No –– Yes | Indicator of potentially suspicious activity. |
Notice I describe the risk factors in slightly different groupings. Depending on the methodology and construction, a risk factor can be constructed to describe different aspects of the customer e.g., Length of Relationship based on customer can reflect Who but if based on account can be the When.
Note: This is not an exhaustive list of risk factors. You may have more or less depending on how you choose to represent the various risk factor types and the applicability to your customer base.
Applicability by customer segment
After establishing the desired risk factor types based on business applicability, the next step is to determine the component risk factors in each type and the applicability of risk factors per customer segment. A sample segment to risk factor map could look like the graphic below.
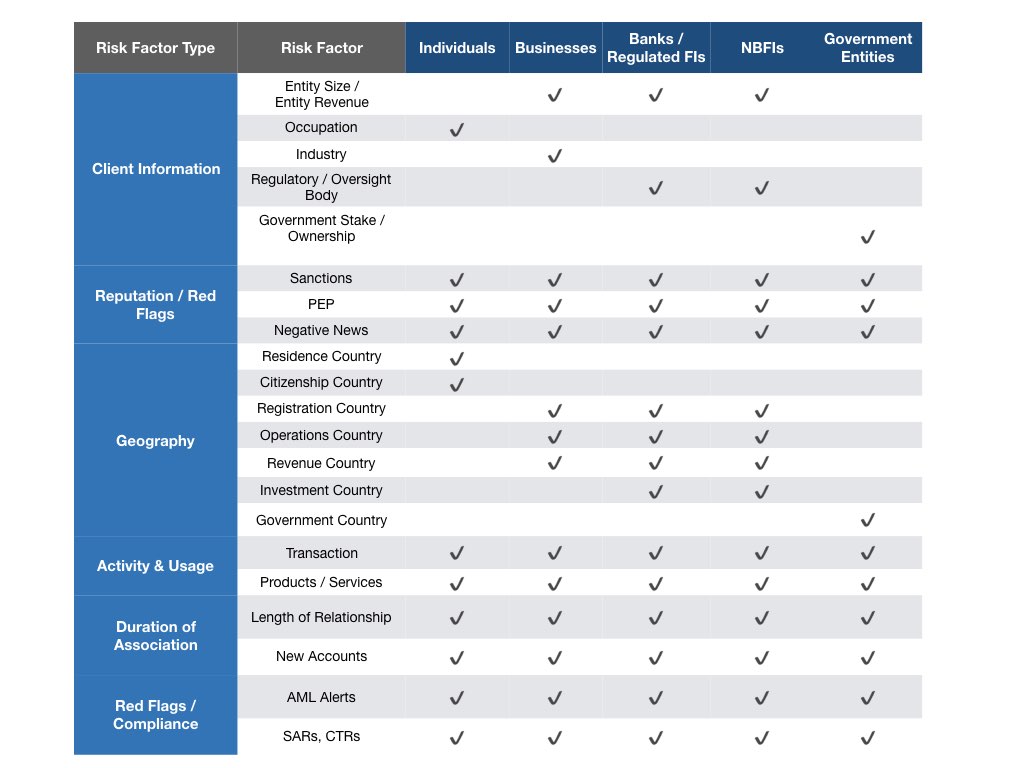
Note: This is illustrative only. The FI must take care to justify the rationale for risk factor and customer segmentation choices with subjective and quantitative evidence. Subjective evidence could be: regulatory drivers, the FI’s expert opinion, past experience based on detection of suspicious behavior; Quantitative evidence could be: data availability, rate of occurrence of risk factors in the data, correlation of risk factor values, predictive value of risk factors in manual assessments, statistical profiles of customers based on individual risk factors.
Auto high risk factors
FI’s invariably tend to auto classify a small subset of their customer as very high risk (or the top risk level of their chosen risk rating scale) based on the presence of certain risk factors. For instance, being a PEP may automatically generate a high risk designation. While FinCEN guidance does not explicitly require auto high risk classification, this approach is generally adopted out of conservatism to meet regulatory obligations. The logic is that as some factors are drivers for EDD, by extension these (or some of these) should also warrant high risk customer rating.
Auto high risk classification is entirely the FI’s choice and based on its risk tolerance –– but the risk factors adopted require require carefully thought. Staying with the PEP example: Are all PEPs necessarily high risk or should additional information such as the nature of political relationships or relationships to other customers also be considered? Should the intersection of being a PEP with other risk factor(s) be necessary for auto high risk?
If you choose to adopt auto high risk classification, you have to make a decision of distinction:
- Should the CRR model generate all levels of risk ratings –– including the same high risk level used for auto high risk classification –– or only generate other levels of risk ratings (i.e., explicitly differentiate between auto-classified risk level and the model generated risk levels)
- How you view the difference between auto-classified high risk customers and those determined by the model? Do these two groups present the same level of risk?
These distinctions impact how you expend resources on monitoring higher risk customers and managing/allowing potential downgrades in future risk rating cycles.
Quantifying risk factors
Clearly, risk factors take on values of different data types: numerical, character, binary, free form text, and possibly even unstructured data like images, tweets, and documents. Using non-standardized data inputs with different types, scales, and dimensions in a mathematical model tends to create all kinds of problems of use and interpretation: Is it meaningful to compare a categorical and a numerical attribute? A currency and a count?
So, it is preferable and advisable to provide data inputs ready for model use. That is, separate the model function from data cleansing, standardization, and transformation (more about this in the Data Availability section later). It can get very messy and a wasteful maintenance overhead to use and maintain non-standardized data in a model –– having the model first transform the data and then generate risk ratings is likely to introduce errors in interpretation and use as the complexity of data requirements increases.
There are different options for standardizing and quantifying raw risk factor values for use in a CRR model. The most common approach is to translate the risk factor values into numerical risk factor levels. Each risk factor likely will have its own business rules for translation based on data distributions, statistical profiles, and inherent risk associations. The transformation and translation should be handled by deploying a data integration process that stages and transforms the raw data into the required data format and then into the final risk factor levels that will be inputs to the model. This strategy allows:
- separate development and maintenance of code for data integration
- traceability of data provenance and data lineage
- recording snapshot of raw data and risk factors used for a rating
- audit history of rating changes with corresponding input data changes
- (independently of the model) reacting to and maintaining upstream data changes, new data sources, or changes to risk factors.
Example of risk factors to risk levels translation For instance, say a customer is an Individual, is a citizen of Russia, operates an automobile repair shop, has a savings account where he is the only owner, has a relationship with the FI for 6 months, and conducts mainly wire and cash transactions. Each of these is a risk factor value that must be mapped to a numerical risk level. The table below shows an illustration using a risk scale of 1 (low) to 10 (high) for every risk factor.
| Risk Factor | Risk Factor Value | Risk Factor Level |
|---|---|---|
| Customer Segment | Individual | 3 |
| Account Type | Savings | 1 |
| Ownership Type | Owner | 1 |
| Country of Citizenship | Russia | 10 |
| Occupation | Owner, Automobile repair shop | 7 |
| Length of Relationship | 6 months | 10 |
| Transactions | Wires and Cash | 8 |
The CRR model then uses the risk factor levels as inputs for generating the risk rating.
Note: The choice of scale for risk factor levels merits a separate discussion. But choosing the scale and whether the scale is the same for every risk factor depends on things such as: relative importance of risk factors, model type, relative importance of risk for different values of a risk factor (should risker values get a linear or non-linear increase in weight)?.
Transaction Monitoring alerts
Transaction monitoring alerts are instantiations of suspicion of money-laundering. This makes alerts a proxy for dynamic information about the customer’s behavior. So it is logical that potentially suspicious behavior identified with respect to transaction monitoring red flags should feed into a customer’s risk evaluation.
There are several options for using alerts as a risk factor depending on your transaction monitoring scenarios and desired level of complexity:
- Alert Value / Volume The simplest choice is to quantify the alerts generated for a customer (by relating alerts on accounts to the controlling customers on the account) either in absolute volume (number of alerts) or value (monetary amount of transactions) over a period of time.
- Alert Groups Another approach is grouping alerts by activity of concern such as rapid movement of funds or high velocity, high risk geographies, wire transfers, cash reporting, and so on. Assign different weights to each group or weight alerts based on aggregate volume or value.
- Alert Importance Another variation is to assign a weighting scheme based on presence of alerts across groups.
- Combination of approaches provides added complexity, if needed.
Warning: Beware of complexity creep for too little benefit unless you can support it with data evidence. If your TM system generates too many false positives, then using alerts as a risk factor requires detailed analysis for selecting an appropriate measure as input to CRR.
Weighting
While compliance experts rely on history, expertise, and regulatory policy to make judgements about relative risk, say between Citizenship Country and Mailing Address Country, there is no meritorious and scientific rule book about such judgements. At best it is an exercise in comparative judgement of variables shaped by experience and obligation (that itself may be biased by other factors). Increase the number of risk factors to be evaluated, and more the judgement bias introduced.
From the discussion on risk factors, it is apparent that just as no single risk factor is a good predictor of customer risk, it is also improbable that every risk factor has the same effect on customer risk.
This leads to the question: What is the relative importance of risk factors? Or, what weighting scheme to use?
A combination of expert judgement and data evidence should direct the decisions for weights. Note that weighting risk factors is a complex topic of discussion by itself. So, a few points to note:
- Ranking and Bias Individual experts have strong views and opinions which manifest as biases about risk factors and their importance. So, any weighting scheme will have some subjective bias.
- Stability The bias is unlikely to be stable. This means different experts may not agree on which factor is more important and the same expert may not be consistent in their ranking of importance (will be impacted as the number of risk factors and their values increases and becomes harder to interpret).
Keeping these issues in mind, some basic questions you need to consider are:
- What weighting method do you want to use? (Multi Criteria Decision Analysis methods such as Weighted Sum, Simple Multi-attribute Rating Technique, Pairwise Comparison; Propensity Weighting; Relative Weights)
- What is the amount of increase to be attributed with addition of one high risk factor?
- Is the weight for a risk factor a function of its occurrence in the data? (e.g., rarer the occurrence, higher the weight)
Have a rationale. Support with data evidence. Be aware of bias. Choose what makes sense for your FI.
Customer Risk Rating scale
There is no regulatory prescription for a CRR scale. FI’s can adopt a scale (and corresponding categorical levels) appropriate for their size and needs for customer risk categorization. As with any classification situation, it is important to understand end use: How will qualitative customer risk ratings be used by the FI’s front line staff, compliance units, regulatory reports, and any other enterprise function.
- Number of levels Generally, when seeking to classify a population in more than two groups, three to five levels offer an intuitive balance between separation and comprehension. Using more than five levels quickly introduces difficulty in expressing and interpreting the difference between classes, especially adjacent ones.
Some of the commonly used CRR scales are:
- Low – Medium – High
- Very Low – Low – Medium – High – Very High
- Low – Medium Low – Medium High – High
- Difference between levels Be clear about the difference (notional and actual) between adjacent classes.
- Is the difference in risk for L v. ML and MH v. H (on the L / ML / MH / H) scale identical?
- What is the interpretation of the risk differential required to be promoted or demoted to an adjacent class? Does it take less risk to be promoted from MH to H than it does to be promoted from L to MH? Is length of time a consideration in how much of a risk factor must change to be demoted to a lower risk level?
- Do you want to allow non-adjacent rating movement (say from H to L)?
- Scale appropriate for use Also important is choosing a scale that is appropriate for model outputs and will serve required end uses –– the scale should not require transformation to another scale. For instance, you want to avoid the model generating risk ratings on a five point scale and then transforming it using some binning strategy to a four point scale because of a legacy need or limitation in some other system. Such a transformation is extremely hard to justify and will raise all kinds of internal and external audit flags.
Data availability
Where is the data for risk rating?
From the risk factors it’s clear CRR has intensive data needs. FI’s are notorious for enterprise data living in silos, in disparate sources and formats, serving different enterprise functions, with varying levels of accessibility and quality.
So, the very first step is for the FI to identify:
- What data is needed?
- Where is the data?
- How to get it?
Warning: In my experience, enterprise data awareness is invariably a project in itself if not previously performed. Often, business users, and even data scientists who distance themselves from the ground realities of “where is the data and how do we automate its use in production,” assume that data visible in an application is data ready for use elsewhere. A really bad assumption!
How is the data collected?
Answering the questions What data is needed? and Where is it and how to get it? requires understanding how data is collected at the FI and the various front end and back end systems that capture, process, store, update, and manage that data.
Some examples are:
- KYC data from front end systems (entered by front line staff)
- Reviews and updates from compliance analysts
- Customer and Account information files (master data)
- Transactional systems (transaction detail, linkage of transactions to accounts and customers)
- Reference data (customer types, account types, products, services, watchlists)
- Referential data (linkage of customers and accounts, beneficial owners)
- External data (OFAC, 314a list, external entities, negative news)
- Transaction Monitoring (alerts)
- Compliance data (SARs, CTRs)
This process leads to an overall understanding of data and the owners and experts who can identify sources, availability, and access.
What is the quality of the data?
With the data requirements and sources identified, the next major task is assessing data quality. This is a critical part of model development, and one of the hardest, typically underestimated.
Data quality is the process of determining the state of information to answer the question whether the data is fit for use.
For CRR we need a variety of qualitative and quantitative attributes that describe customers, and that are inputs to a model for generating customer risk ratings. So, we have to assess data quality –– actual versus desired state –– on multiple dimensions enumerated in the table below.
| Dimension | What it means |
|---|---|
| Availability | Does data reside in an existing data infrastructure? |
| Accessibility | Is it accessible easily, repeatably, & programmatically (no manual process)? |
| Completeness | What is the proportion of available data (records and fields) relative to the universe of data (100%)? |
| Consistency/Coherence | Does data represent the same information across different data sets or sources i.e., unconflicting information? Is it in sync? |
| Conformity/Validity | Does the data comply with definition and business rules: type, format, values, range? |
| Accuracy | Does the data correctly describe the real world object or event? |
| Integrity | Can the data be traced and connected through relationships across sources? (e.g., accounts to customers and transactions) |
| Uniqueness | Can data be identified and referenced uniquely based on one or more identifiers? |
| Currency | Does the data represent information correctly as of the required point in time? Is it up to date as of the time needed? |
| Timeliness/Latency | Is the data available when needed, with the least possible delay? |
Warning: Across global financial firms to community banks, I have repeatedly witnessed the impact of poor data quality on the efficacy of a CRR model. I cannot stress just how critical it is to get this right!
Data integration pipelines
With the data quality assessment done, it is time to create the data integration infrastructure for CRR. This is the Extract-Transform-Load (ETL) design and implementation supported with detailed documentation described below (could be Extract-Load-Transform (ELT) depending on your data infrastructure).
| Step | What is it? | |
|---|---|---|
| Data Specification | Set of rules and standards agreed to by the business and technology teams governing how data will be provided based on target CRR data requirements. | |
| ETL Specification | Details covering the CRR requirements for the data – when, where, and why the data is needed; scope of meeting the business objectives based on the functional data specifications. | |
| ETL Configuration, Scheduling, and Monitoring Specification | Play book for orchestrating, managing, and reporting of ETL processes (including fail safes and disaster recovery) that acquire data, transform it, and create outputs as per the needs of CRR. |
Of course, this will not be perfect and several assumptions will be necessary about the data and exception handling. It is necessary to understand that data integration is an ongoing task dictating and improving the quality of data provided as input to CRR. The key pointers to remember are:
- Make assumptions and justify them
- Handle missing data
- Build robust quality control checks, error logging, and feedback loops
- Automate
- Clean ! Clean! Clean!
Note: Data sourcing and integration for any data driven model is typically a full fledged project. If you don’t have a robust data infrastructure the sensible way to approach data integration for CRR is to start small and build up in steps.
Model types
I have been participant to a variety of models deployed for AML and customer risk rating at financial institutions of varying size, retail and correspondent, global and domestic. In discussing model types, my intent is to present the approaches that I have seen in use and highlight some considerations and shortcomings.
The brief description of some modeling options shows there isn’t a one-size fits all or clear-cut model choice. The idea is to understand your customer base and explore model options suited to data availability and applicability while balancing complexity and performance.
Early models
Early versions of customer risk models used static parameters (risk factors) mapped to compliance analysts (usually subjective) assessment of risk levels. For instance, using a 100-point scale where 1 is not risky to 100 is extremely risky: country of residence Iraq was assigned 100 while United States was assigned 1; Occupation of Arts Dealer was assigned say 80 while Owner of Lodging Property was assigned 50, and so on. A customer’s CRR score equalled the aggregate score of all applicable risk levels. A subjective mapping of aggregate risk score ranges to desired CRR levels –– say using quantiles mapped to High, Medium, Low –– provided the final CRR determination.
This approach is clearly limited in that (i) risk level mapping is based on experts’ intuition and regulatory requirements but not quantitative evidence and (ii) all risk factors are weighted equally. Not considering relative importance of risk factors generated a lot of false positives resulting in resource wastage and even client dissatisfaction.
Weighted Average
The weighted average CRR approach was quickly adopted in response to the limitations of the aggregate risk score approach, and its use is still prevalent. FIs are able to tailor risk factor-to-risk level mappings by client segment, incorporate weighting schemes based on their data characteristics as well as adjust the importance of risk factors to suit their business, customer base, and risk tolerance.
Machine Learning Models
Machine learning models use supervised or unsupervised learning techniques. Supervised learning learns and trains a model using known input (predictor variables) and output (response or predicted variable) data values. This means the model needs labeled cases to learn from. In the context of CRR, we would need training data where each record represents a customer and their risk factors (inputs) with an explicitly assigned CRR category (output). The model then learns from this known data to predict the response variable from future data. Unsupervised learning does not need labeled data but draws inferences from known input data to find patterns.
Warning: Creation of training data with labeled responses is an extremely important aspect of supervised learning model development that I am not getting into here. Use of supervised machine learning for AML/CRR is thrown around a whole lot but without the deep, complementary discussion necessary regarding how exactly do you provide labeled data. The very small number of actual cases of financial crime within an FI relative to its size are not sufficient to generate a reasonable training sample.
Then there is the problem of unbalanced data and bias, even if you have a set of labeled data: by definition, most of an FI’s customer base will tend towards the middle to lower end of the scale, creating unbalanced sets of data in each CRR level, thus leaving an extremely small number of risky customers to learn from.
Logistic Regression
FIs typically use three to five levels for their CRR scale. In reality, the highest risk level is typically the auto high risk category –– presence of one or more risk factor values that are mandated as high risk by regulatory guidance or for which the FI has little risk appetite, automatically make the customer high risk warranting extra scrutiny.
But more often then not there is no clear articulation about the relative difference between the remaining risk levels. What is the difference between a Low and a Medium Risk customer? What is the difference between Low Risk customers: one with the lowest risk level for every applicable risk factor v. another with one or more risk factors that exceed low risk?
One way to approach answering these questions is a one versus the rest approach using logistic regression, a supervised learning method. Using a model (on the population that is not deemed auto high risk) to predict the probability of the customer being risky/not risky could help determine the distinct risk levels suitable for the FI’s needs.
Multinomial Logistic Regression
For classifying the entire customer base into more than two distinct CRR levels, you can consider multinomial logistic regression, a generalized form of logistic regression for multi-class problems. Multinomial regression extends binary logistic regression to allow more than two classes of the outcome variable.
With multinomial regression you can treat risk factors as the independent variables (in reality the risk factors will have interactions) and CRR as the dependent variable (taking three or more values as desired). The idea is to predict customer risk category from the risk factors, which may be categorical, binary, or real.
Basic Assumptions
- Nominal dependent variable The dependent variable, CRR, is nominal i.e., there is no intrinsic ordering between the risk levels.
- Independence of dependent variable The dependent variable is mutually exclusive (no overlap between CRR levels) and exhaustive (every customer can be classified into exactly one of these levels).
- Case-specific data Every independent variable has a single value for each case (e.g., Country of Operations must be reduced to a single risk level even though a company can have operations in multiple countries).
- Non perfect separation Dependent variable cannot be perfectly predicted from the independent variable(s) for any case (auto high risk cases should be excluded).
- No outliers No extreme cases.
- No multicollinearity Two or more variables are not highly correlated.
Ordinal Logistic Regression
Ordinal Logistic Regression is the generalized form of logistic regression that predicts an ordinal (ordered) multi-class dependent variable.
Intuitively, CRR, our dependent variable, which has values on an arbitrary scale (e.g., 3, 4, or 5 levels) has implicit ordering between levels. Using rating levels Low / Medium / High, we understand that High Risk is worse than Medium Risk and Medium is worse than Low. So, ordered logistic regression could be a candidate for risk rating customers.
Basic Assumptions
- Ordinal dependent variable The dependent variable, CRR, is ordinal i.e., there is relative ordering between the risk levels (e.g., Low – Medium – High).
- Explanatory variables are continuous, ordinal, or categorical.
- Proportional Odds Each value of the dependent variable is the logarithm of odds of the cumulative split of the dependent variable. Each independent variable has the same effect at each cumulative split of the dependent variable (the constant added to each of these logarithms to get to the next category is the same in every case).
- No outliers No extreme cases
- No multicollinearity Two or more variables are not highly correlated
Note: Ordinal logistic regression could be used to predict CRR but meeting the assumption of proportional odds is key. This assumption is often violated.
Decision Trees
Decision Trees are a non-parametric supervised learning method for classification using simple decision rules learned from the data. Simply put, this means:
- Non-parametric method Model makes no assumptions about the data distribution (operates on observed data i.e., supervised learning)
- Hierarchical decisions Model is defined by a series of hierarchical if-then questions based on data attributes, each resulting in a split ultimately leading to a class or category label of the target (output) variable.
Decision trees are simple to understand, require little data preparation, and can handle a multi-class output variable. The approach also is very comparable to human decision making –– this can be very helpful in articulating how CRR decisioning is made by experts. A decision tree model is easily explainable as the true/false splits are based on observable data.
But there are downsides (that can be mitigated with added complexity). Decision trees may:
- easily become intricate with non-generalizable splits –– overfitting to training data but not performing well on unseen data.
- be unstable (too sensitive) due to slight data changes and result in different decision splits producing different results.
- create bias due to overrepresentation of some classes.
- may find locally optimal solutions that are not globally optimal (because the tree’s goal is to achieve the best result based only on the information it knows at that point)
Considering the pros and cons, decision trees may be most useful in discovering risk factors impacting certain risk levels and whether a set of if-then style rules result in categorizing a subset of customers. Such customers can then be assigned a risk rating using decision trees and the remainder of customers could be rated using a different method.
Clustering
Clustering is a common unsupervised learning method used for segmenting a population into groups based on common characteristics. In the context of CRR, this means customers assigned to one group are more similar to other customers in the same group than those in other groups.
There are several types of clustering algorithms using different mathematical techniques, the discussion of which is beyond scope here. Clustering can be very helpful for exploring characteristics of your customer base and segmenting customers to find and justify applicable risk factors. However, it has some critical disadvantages that limit its applicability for CRR:
- May produce different cluster composition on each run
- May result in different number of clusters on each run
- May not be able to find special cases or outliers
- May become too complex to interpret
- Not suitable for very large data sets
So, clustering could well help with better data understanding or even for comparison to a chosen CRR model, but is not ideal by itself for CRR.
Hybrid approach
FI’s haven’t really warmed to adoption of hybrid approaches. But given the need to balance regulatory expectations, risk appetite, and use of sophisticated models, it is definitely an area that deserves attention.
There may not be justification for a model to predict risk ratings on the entire customer base. So, establishing the rationale for separating the customers that are undoubtedly low risk or very high risk based on discrete criteria or using simple models might be a good place to start. This leaves room for exploring novel approaches for estimating risk for the remaining customers –– the ones that cannot easily pegged into a risk level.
Ongoing monitoring & outcomes analysis
Once you deploy a CRR model into production use, you must monitor it for continued relevance and performance. This is a formal Ongoing Monitoring framework that must identify the objectives of the monitoring plan with detailed steps, expectations, and actions.
Note: This is a challenging part of using a CRR model and many FI’s struggle in this area.
| Task | What it involves or verifies |
|---|---|
| Documentation | Formal specification describing the process of ongoing monitoring. Individual objectives, steps to be performed, evaluation metrics and criteria, warning thresholds, review teams, actions when thresholds are breached. |
| Input data audits | Internal and external data inputs are appropriate, accurate, and complete. |
| Regulatory guidance | Changes driven by updates or changes to compliance laws and regulations have model coverage. |
| Relevance | Model as developed with training (developmental) data continues to produce stable and expected results with the validation sample (this is some future or Out of Time (OOT) data). That is, the assumptions and characteristics of training and OOT validation data are not statistically different. |
| Stability | Results stay stable even with unexpected input data changes. (e.g., rating levels don’t fluctuate dramatically because a higher rate of occurrence of a risk factor’s value) |
| Sensitivity | Model works across possible ranges of data inputs and conditions. Model should not have varying performance based on data, business, or market conditions. |
| Performance Evaluation | Model results satisfy measurable criteria for meeting objectives and intended use. |
| Benchmarking | Comparison of model results to baseline (e.g., regulatory, other FI, home grown reference providing floor, thresholds, bounds) to assess model performance. |
| Organizational changes | Data implications due to acquisitions, mergers, changes in products, services, client base, market conditions, risk appetite, or other events. |
| Records and Reporting | Tracking results from monitoring cycles in a format that facilitates comparison and internal and external reporting. Include capture and storage of input and output data. |
Outcomes analysis involves comparing model outputs to reality. For instance, how do you measure that the model rightfully rated customers Medium-High and none should have actually been rated lower or higher.
- One aspect of this validation is to check the actual computation.
- Another is to manually assess whether the model correctly interprets the overall risk presented by each of the individual risk factors.
- Yet another is the frequency of overrides (manual or automated) applied to the CRR outputs. Simply put, the FI has to validate the model outputs make sense.
- Backtesting or comparing model outputs with actual outputs on a historical data set that was not included in model developmental data but meets the same assumptions and criteria.
Conclusion
Customer Risk Rating is a complex exercise because money laundering and terrorist financing are areas that are not quantifiable and measurable precisely. A common refrain from compliance analysts is:
“I know suspicious behavior or potential money laundering when I see it. But I can’t tell you the discrete characteristics that make it so.”
In other words, experience, instinct, and knowledge of and adherence to regulatory policy are key.
Nevertheless, I have discussed several risk factors and different approaches for quantifying risk that can help estimate customer financial crime risk. But clearly every part of developing a CRR methodology requires extensive assessment and development, with careful justification based on expertise and data evidence.
To summarize, here are the highlights, in my opinion, for a Customer Risk Rating methodology.
- Keep it Simple –– complex models cannot be explained to regulators effectively
- Select and quantify risk factors –– understand your FI and use a risk-based and data-based assessment to select applicable risk factors
- Assess data availability and quality –– beware of garbage in garbage out
- Design data inputs and data integration –– separate data input and model functions
- CRR scale –– rating levels that promote risk-based treatment and have use across the FI
- Model type, development, validation –– try different approaches; be rigorous in developing rationale and assessing performance
- Auto high risk –– establish criteria and difference from model ratings
- Overrides –– use carefully! excessive overrides indicates poor model performance; opens door for rating manipulation
- Rerating triggers react to key events such as account control/ownership change, SAR filing, AML alerts, beneficial owner change,…
- Document rationale –– segmentation, risk factors, weights, models considered, model selected
- Don’t strive for perfection –– cannot have a perfect model; so risk appetite must be established coherently (what can you afford to miss? what would be the exposure to the FI?)
- Evolve risk ratings –– take a dynamic approach; propagate customer changes into rerating processes instead of a periodic approach
- Monitoring –– measure outcomes, compare performance over time / with manual assessment
- Feedback loop Evolve model based on outcomes monitoring results and adapt to changing laws and regulations